Logistic map is one of the most simple examples of system with chaos. Along with Hénon map it’s a very famous “classic” system.
“The map was initially utilized by Edward Lorenz in the 1960s to showcase properties of irregular solutions in climate systems. It was popularized in a 1976 paper by the biologist Robert May in part as a discrete-time demographic model analogous to the logistic equation written down by Pierre François Verhulst.” Wikipedia
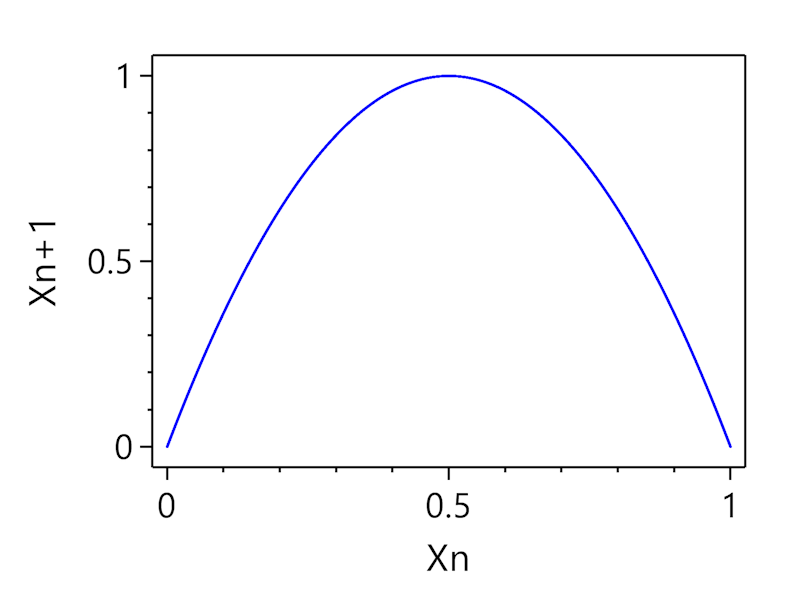
The Logistic map is described by equation:
\[x_{n+1} = rx_n(1 - x_n)\]Default parameters: $r=4$
Initial conditions: $x_0=0.1$
$x_n$ takes values between 0 and 1 and reflects population size on n-th year, $x_0$ is initial population size (year 0), $r$ – positive parameter describing reproduction rate (growth) of population, $n$ – current year
Bifurcation diagram
| Bifurcation diagram for parameter a |
|---|
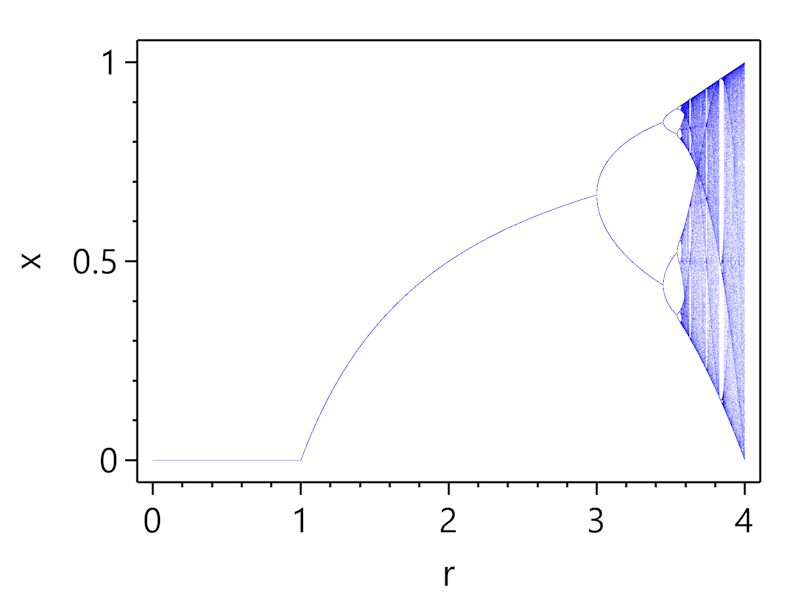 |
Frequency analysis
| FFT Power spectrum | Wavelet |
|---|---|
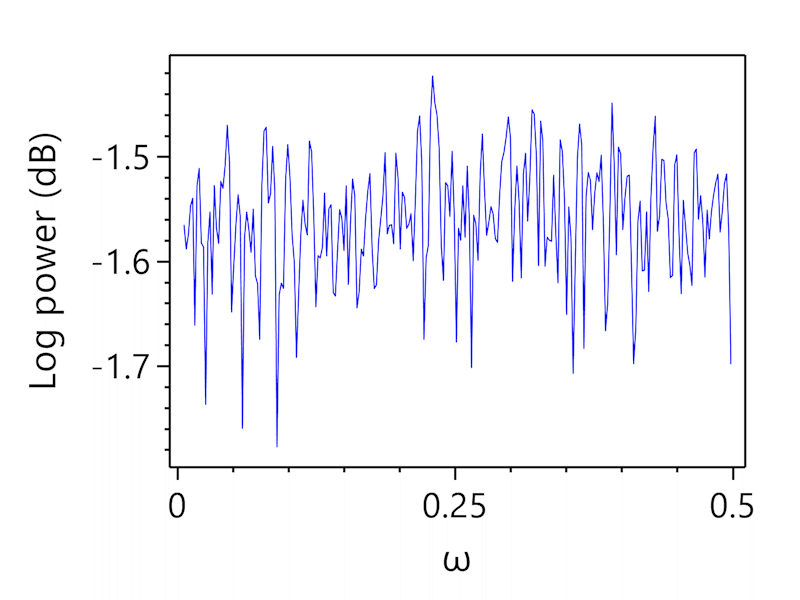 |
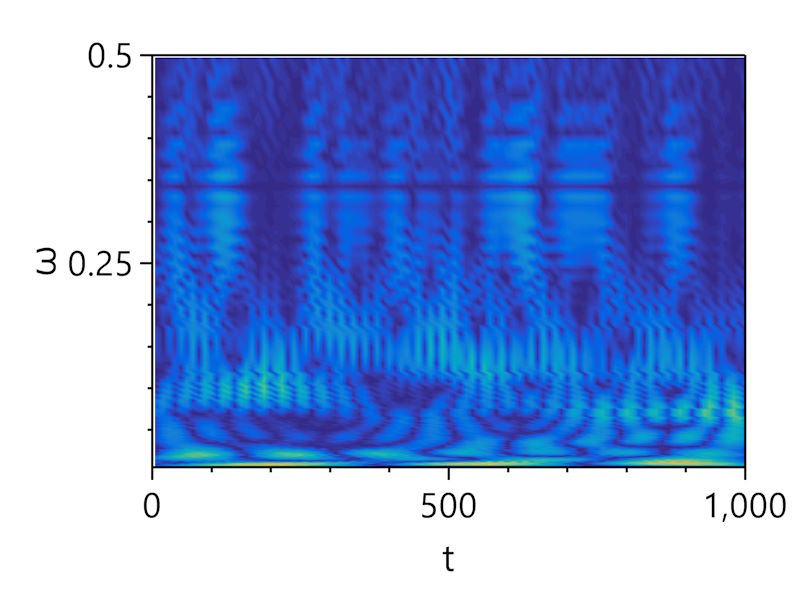 |
Power spectrum of the map is noisy on both FFT power spectrum and wavelet charts, it’s not possible to distinguish any specific frequency.
Lyapunov exponents
Lyapunov exponents spectrum of the map has only one value. For default parameter value LLE is positive and is equal to $λ_1 = 0.69315$ what indicates chaotic nature of the system. Lyapunov (or Kaplan-Yorke) dimension is $1$.
Let’s take a look at LLE dynamics for parameter $r$.
| LLE dynamics for parameter r |
|---|
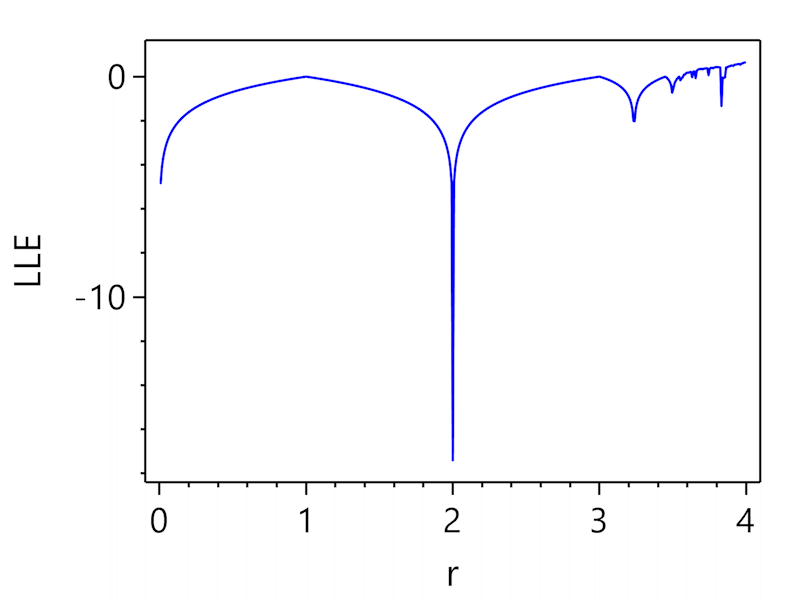 |
It’s not possible to build a map of Lyapunov exponents spectrum as the system has only one driving parameter.
References
- May, Robert M. (1976). “Simple mathematical models with very complicated dynamics”. Nature. 261 (5560): 459–467.
- Verhulst, P.-F. (1845). “Recherches mathématiques sur la loi d’accroissement de la population.” Nouv. mém. de l’Academie Royale des Sci. et Belles-Lettres de Bruxelles 18, 1-41.