Hénon map is a discrete-time dynamical system. It’s one of the well known examples of dynamical systems that exhibit chaotic behavior.
“The map was introduced by Michel Hénon as a simplified model of the Poincaré section of the Lorenz model. For the classical map, an initial point of the plane will either approach a set of points known as the Hénon strange attractor, or diverge to infinity.” Wikipedia
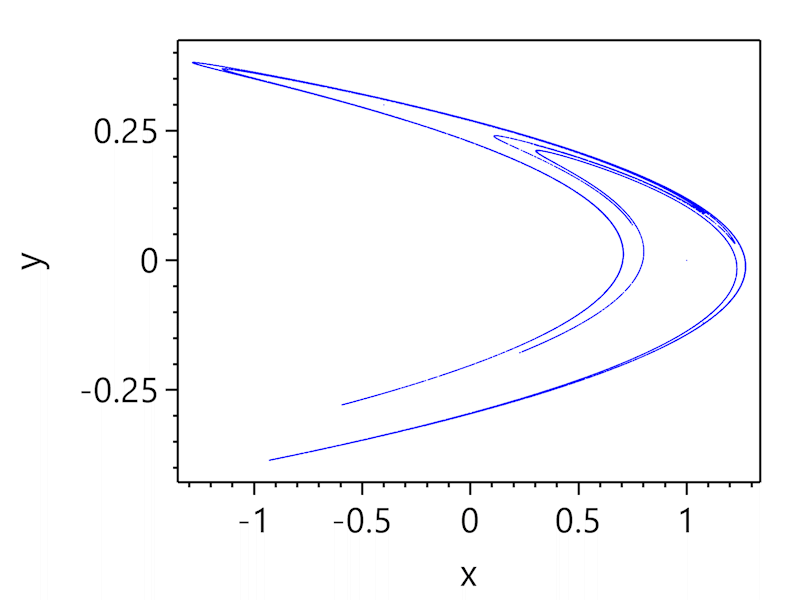
The Hénon map takes a point $(x_n, y_n)$ in the plane and maps it to a new point by next law:
\[\begin{cases} x_{n+1} = 1 - ax_n^2 + y_n\\ y_{n+1} = bx_n \end{cases}\]Default parameters: $a=1.4, b=0.3$
Initial conditions: $x_0=0, y_0=0$
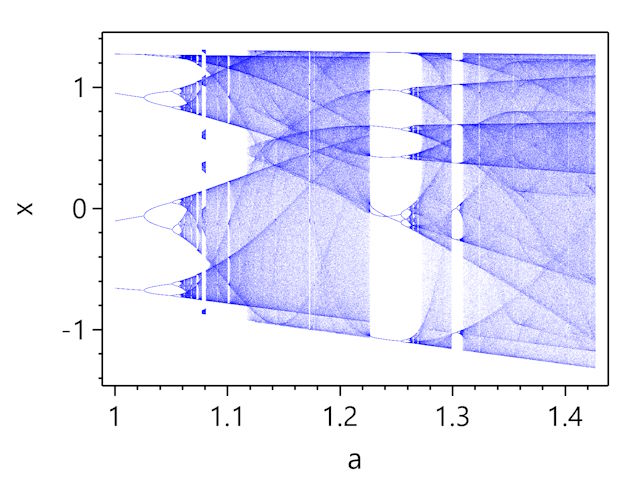
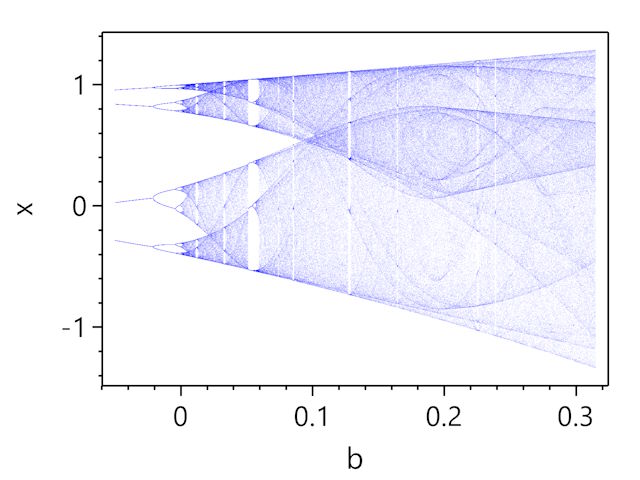
Bifurcation diagram
| Bifurcation diagram for parameter a | Bifurcation diagram for parameter b |
|---|---|
 |
 |
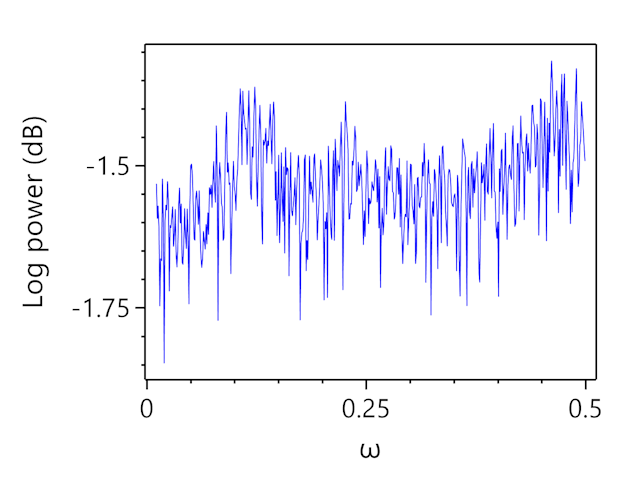
Frequency analysis
| FFT Power spectrum | Wavelet |
|---|---|
 |
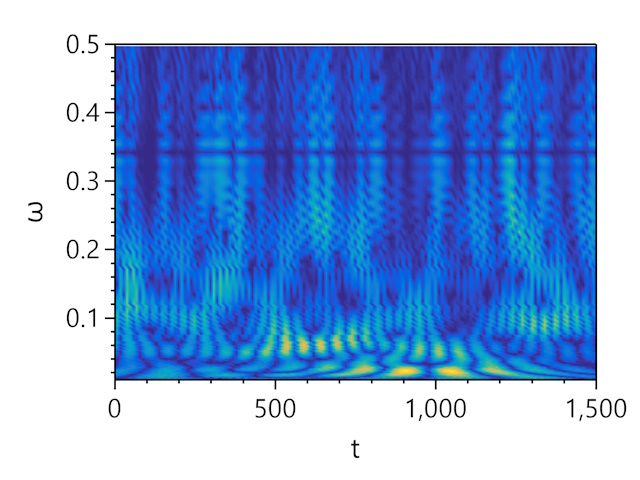 |
Power spectrum of the map is pretty noisy, but it’s possible to notice two peaks: $\omega \approx 0.125$ and $\omega \approx 0.455$.
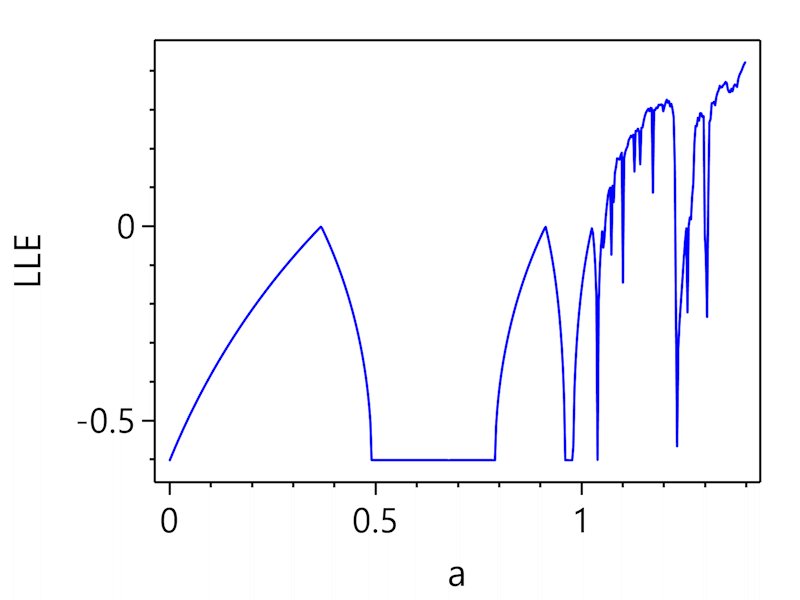
Lyapunov exponents
Lyapunov exponents spectrum of the map consists of two values. For default parameters LLE is positive and the second exponent is negative and spectrum values are: \(λ_1 = 0.4192, λ_2 = −1.6232\) what indicates chaotic nature of the system. Lyapunov (or Kaplan-Yorke) dimension is $1.2583$.
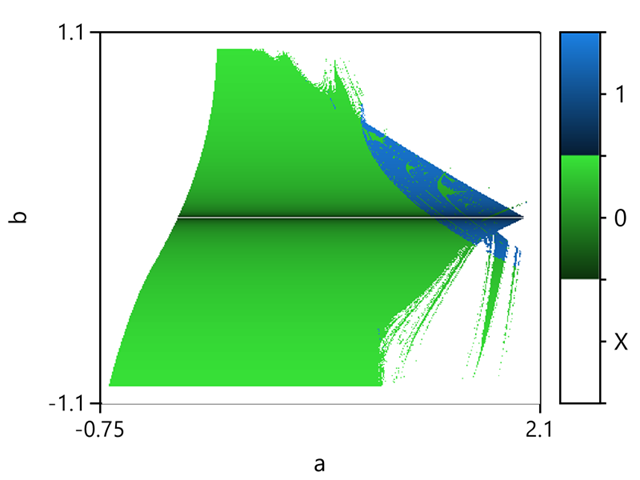
But more interesting is to see dynamics of Lyapunov exponents on driving parameters range. Both parameters have significant influence on LLE value.
| LLE dynamics for parameter a | LLE dynamics for parameter b |
|---|---|
 |
 |
The map of Lyapunov exponents spectrum shows that the significant part of area of driving parameters leads to absence of chaos, where no positive LEs exist in spectrum, the area of driving parameters is pretty small (white color indicates solution decay)
References
- M. Hénon (1976). “A two-dimensional mapping with a strange attractor”. Communications in Mathematical Physics. 50 (1): 69–77.